In this post, we report optimization results for a list of US and EU real estate stocks including commercial and diversified REITs. The training period is 1000 trading days ending on August 6, 2018. The two out-of-sample backtesting periods are considered - 150 days and 350 trading days: August 7, 2018 - December 21, 2019. The original list contains 683 stocks. After data processing, outlier and liquidity analysis 468 stocks are selected. After the correlation analysis, 345 stocks are left in the shortlist.

We build a Monte Carlo model with negative macro-modeling. We assume that SP&500 will perform worse in the testing period in comparison to its performance in the training period. Hereby, we would like to build a portfolio of real stocks with low beta and defensive to negative market fluctuations. We generate 1000 scenarios and built a tail risk optimization model.

From the efficient frontier of solutions, we choose the 14th solution as it seems to represent the optimal trade-off between the tail risk and portfolio return. The optimal solution (with a red fill) provides close to the highest portfolio return and only a small increase in tail risk.

The resulting portfolio return distribution has an asymmetric shape with smaller left tail and unproportiantely heavier right tail of returns.

Benchmark (blue line) represents the average return of stocks in the original short-list, i.e., equal-weighted portfolio. We can observe that the drawdown of an optimal portfolio with 28 stocks is significantly lower than that of the equal-weighted benchmark. Surprisingly, the significant stock price drop of December 2018 is almost completely avoided with the same retained return profile. The Sharpe ratio of the defensive portfolio is several times higher for 150 days testing period 1.45 vs 0.26 of the benchmark.

The optimized portfolio continues to outperform the benchmark in the following 200 trading days until late December 2019 and achieves over 2x improvement in Sharpe ratio (4.5 vs 1.9).

In a new setup, we test the optimization without making any assumptions on the future macro-economic environment. We can observe the drawdown is still largely avoided for the optimized portfolio (Figure 6) and only marginally worse in comparison to a portfolio with negative macro-assumptions.
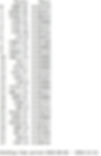
The optimal portfolio contains 28 stocks with a maximum share of 5% (Figure 7).

We can see in Figure 8 that the optimal portfolio with neutral macro outperforms the portfolio with negative macro in the longer term but it is more volatile and has higher drawdowns. The provided results demonstrate the optimization efficiency of developed models. The software finds optimal portfolios of real estate stocks with significantly improved risk-return characteristics. With negative macro-modeling user can build portfolios specifically for falling/volatile markets with more robust results and smaller drawdowns.
To showcase the functionality scenario-modeling in Renexe models we change the task and try to build a "worst" real estate portfolio with maximum drawdowns. Such a portfolio should be very sensitive to market drawdowns and generally market movements (high beta). Hereby we keep the same constraints but maximize tail risk and drawdowns for new portfolios. The new portfolio composition is presented in Figure 9.

The optimal portfolio experiences a massive 40% drawdown as can be seen in Figures 10 and 11. The portfolio value bounces back over 30% but still down around -20% over 350 days testing period (Figure 11).


The scenario-modeling gives investor more freedom to incorporate his/her assumptions and expert knowledge in portfolio optimization and create very customized investment portfolios. For example, as demonstrated above, an investor can build real estate portfolios specifically for volatile/falling markets and minimize or maximize portfolio drawdowns for those scenarios.